How to use F1 Telemetry Data in Python
In this post I will show you how you can start using F1 Telemetry Data in minutes. Lights out and away we go!
Published on October 13, 2023 by Spencer Folkman
F1 Data Analysis Python
4 min READ
F1 Teams are constantly using data from past events to improve their outcomes in future races. By harnessing the power of telemetry data you too can see what it takes to become a World Champion!
Introduction:
In Formula 1, the pinnalce of motorsports, every fraction of a second can make the difference between victory and defeat. That is why technology plays such a pivotol role in allowing teams to understand every aspect of their cars performance in real time. This blog will help you start your journey into dissecting the details that are so vital to success in racing. Let’s get started!
Setup:
While we won’t have the live data view seen on the pit wall, we’ll be harnessing the power of the FastF1 API, which lets us access data right after an event has finished. To start you can use pip to install the FastF1 API. We will also be using matplotlib.
Make sure to also create a new folder inside you main folder and name it cache. This will save the data that you get from the API so you don’t have to run requests multiple times for the same data.
#Imports - fastF1
import fastf1 as ff1
import fastf1.plotting

#Imports - Libraries
import matplotlib.pyplot as plt

#Enable cache to store data
ff1.Cache.enable_cache('cache')

# This is for the first example
fastf1.plotting.setup_mpl(mpl_timedelta_support=True, color_scheme=None, misc_mpl_mods=False)
Loading a Session:
When we want to start looking at data, the API is structured by each events and their sessions. This means that we have to call our data in separately for practice, race and qualifying. To do that we have to specify first the year, then which grand prix and finally the session denoted by a letter.
For example, if we wanted to load the data for the for the most recent Qatar Grand Prix Qualifying we would do the following:
session = fastf1.get_session(2023, 'Qatar', 'Q')
session.load()
After loading the data in it will be saved in your cache so you don’t have to keep running the load function. To load practices you must use FP#, replacing the # with either 1, 2 or 3 depending on which sessiong you would like to look at. If you want the race data you can use R.
Objects and Functions:
Now that we have our data we need, let’s dive in and make a simple analysis. The FastF1 Documentation has more information on all the exact objects we can use, but for this example we are going to use laps to compare the top 2 laps from our qualifying session:
ver_lap = session.laps.pick_driver('VER').pick_fastest()
pia_lap = session.laps.pick_driver('PIA').pick_fastest()
Now that we have the data for each lap we also need to add a distance column to our data so that it is easier to compare our laptimes.
ver_tel = ver_lap.get_car_data().add_distance()
pia_tel = pia_lap.get_car_data().add_distance()
Plotting:
Finally, we are ready to plot our data! First we can assign colors to our objects by using the team.color function and then make a simple plot
rbr_color = fastf1.plotting.team_color('RBR')
mcl_color = fastf1.plotting.team_color('MCL')

fig, ax = plt.subplots()
ax.plot(ver_tel['Distance'], ver_tel['Speed'], color=rbr_color, label='VER')
ax.plot(pia_tel['Distance'], pia_tel['Speed'], color=mcl_color, label='PIA')


ax.set_xlabel('Distance in m')
ax.set_ylabel('Speed in km/h')

ax.legend()
plt.suptitle(f"Fastest Lap Comparison \n "
             f"{session.event['EventName']} {session.event.year} Qualifying")

plt.show()
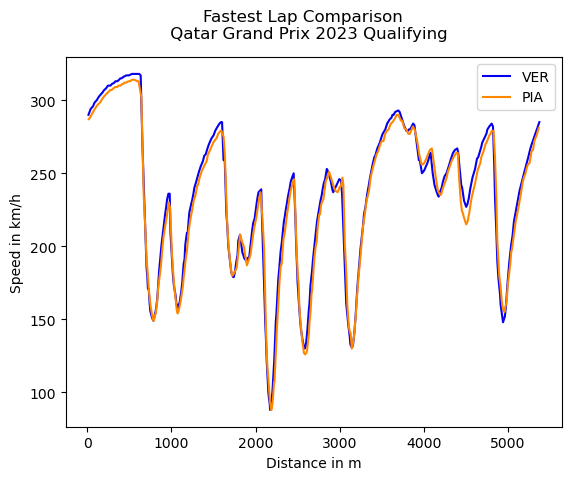
Wow, What a beautiful plot! We can see just how close Max and Oscar were during this qualifying session! It looks like Max really thrived in the straights and fast corners while Oscar got a lot of time back in the slow sections.
Conclusion:
In the fast-paced world of Formula 1, telemetry data is the key to understanding what separates winners from the rest. With this new knowledge you are now ready to analyze your favorite drivers and teams. Now it is your turn!
If you would like to see more, check out some other examples using the Fast F1 API